By Dylan Anderson | 5 January, 2021
After a two month hiatus, all eyes are back on the United States for their second instalment of “Can’t Look Away Election Special,” sponsored by Georgia’s unique runoff voting system for the two open Senate seats. Well, not all eyes. Despite attempts by President Trump, Biden is still the official President-Elect, so if you are not interested in the further dynamics of the three-tiered power struggle in US politics feel free to tune out now.
As you may have heard, the winner of these elections will decide the Senate, potentially giving the Democrats full control of all three levels of government or providing the Republicans with a slim majority that will force the Dems to compromise on any future plans.
Major polling outlets have done a ton of work on this election already (FiveThirtyEight wrote two great articles here and here. You can also get a ton of relevant early voting data breakdowns at https://www.georgiavotes.com/). Nonetheless, working a ton with R and politics, I wanted to do my own estimated analysis by answering three questions using election data from the November contest and the last Georgia Senatorial Runoff election in 2008:
1. How did the Georgia ticket split in the November election in regard to both Senate seats?
2. Based on the 2008 Senate Runoff, what counties returned the largest turnout? How did those counties vote in 2008 and how did they vote in the November election?
3. What can the current early votes tell us about the potential outcome?
Split-Ticket Voting in November
The main difference between the November General election and January’s Runoff is the lack of other votes on the ballot. Therefore, instead of the Presidential, Senatorial, Congressional and State candidates, there are only two races on the ballot — the two Senate races. In the first race, we have the Republican incumbent Senator David Perdue and the Democratic challenger Jon Ossoff. The second race is between the Republican incumbent Kelly Loeffler and the Democratic challenger Raphael Warnock.
Without Trump, Biden or any congressional candidates on the ballot, there will no doubt be less turnout and potentially different votes in the runoff. My first question was about whether some people in November voted for Trump, but not for a Republican Senator or maybe for Democratic Senators and not Biden? So I visualised it in R using a dot chart.
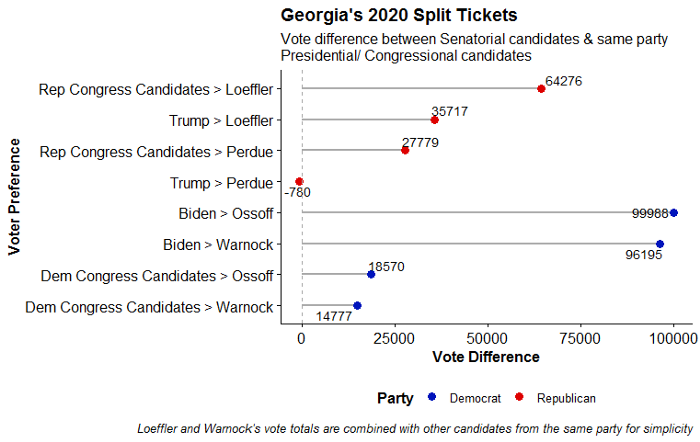
Figure 1 — Graphical differences between the Senate candidates and other party candidates, also known as split tickets!
What do we see? Well, it looks like Biden was a lot more popular than both the Democratic Senate candidates and Congressional candidates. Meanwhile, Trump did not gather significantly more votes than Loeffler and actually got fewer votes than Perdue. It should be noted though, that Loeffler and Warnock’s race had a grand total of 20 candidates, so it is not surprising that she had a worse outcome than Perdue in November.
So while Biden did pick up Georgia in the electoral college, it seems that a lot of his voters also voted for non-Democrat Senate candidates. Whether this turns into a lower democratic turnout remains to be seen, but without the Presidential ballot on the ticket, some Democrats might not feel as compelled to vote, especially seeing as President Trump has already lost the election.
What if Turnout was like the Last Runoff Election in Georgia?
Historically, runoff elections have favoured the Republicans in the past. FiveThirtyEight’s Nathaniel Rakich and Geoffrey Skelley have demonstrated that perfectly in this graphic below:
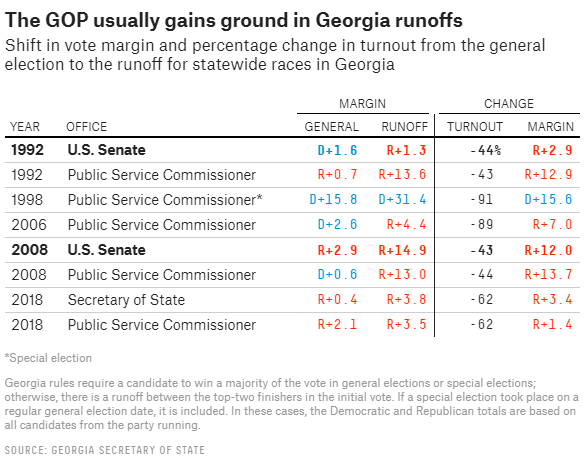
Figure 2 — Fivethirtyeight’s calculation of past Georgia runoffs, which largely favour the Republicans and see much lower turnout than the general election
The biggest factor here is turnout, which dropped by 44% in 1992 and 43% in 2008. With just over half of people showing up, it looks like people didn’t care as much about one-off votes, which might make the difference in this race (although the consequences of this one are a bit more important than 2008). So looking at the 2008 runoff, I took the total turnout by county and mapped it out:
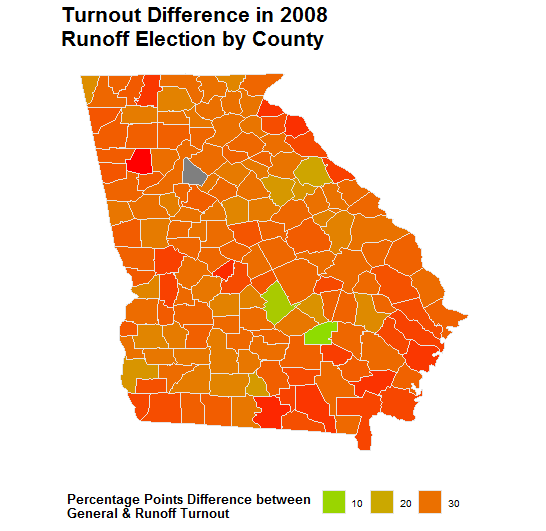
Figure 3 — Difference in Senate votes in the 2008 General and Runoff elections by county
In this map, we can see that most counties saw a drop in turnout of about 30 percentage points from a turnout of about 70.4% to around 39.6%, a number similar to the -43% calculated by FiveThirtyEight. The drop in turnout is pretty standard across the board, with no counties acting as exceptional outliers except for Jeff Davis County, which only dropped 8 percentage points (although this is a 5,000 person county…).
Using these 2008 totals we can take the turnout difference by county and compare it to the 2020 outcomes. This is basically an algebra equation, where we use the 2008 turnout to predict the vote totals in this runoff, again using the November vote. Below you can see the graphic visualisation I ran through R & ggplot2:
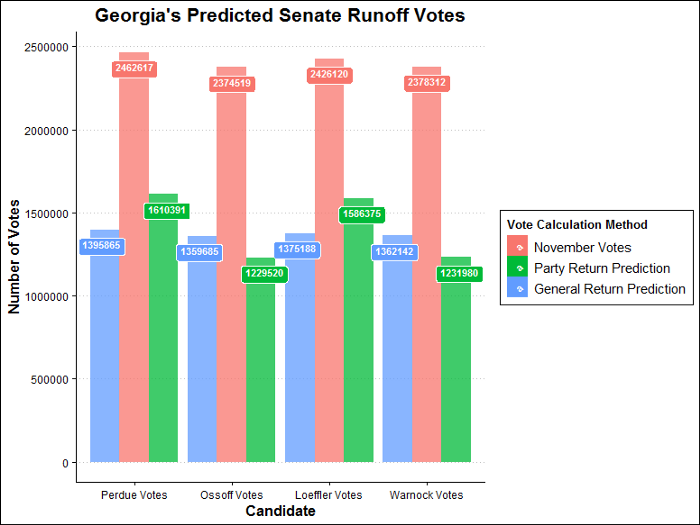
Figure 4 — November votes used to predict the Runoff Outcomes
If the voter turnout remained exactly the same (spoiler, it won’t), the Perdue and Loeffler tickets would win by 36,179 and 13,046 votes, respectively (this I titled the General Return Prediction). Now if we look at the returning party numbers from 2008 that total changes wildly — this is where the GOP margin increase really comes from! Instead of a meagre 36k or 13k, the winning margin for Perdue and Loeffler would rise to 380,871 and 354,395, a very sizeable win indeed. So the Dems definitely knew they had their work cut out for them to try and get out those Democratic voters!
Early Voting is Already Telling a Story - Let’s Use it!
It would be irresponsible to leave you there, but alas, I save the best for last. Based on early voting statistics found from the Election Project, we can make predictions about what the current early vote looks like. Currently, the number of early votes is up over 3 million, which dwarfs the 2.1 million total votes cast in the 2008 Runoff election. Using the proportion of early votes that went in each direction from November, the Democrats would technically have a lead of 149,897 votes, which is fairly substantial. But, as every political report has mentioned, Republicans will tend to turn out Election Day in higher proportions than Democrats. Therefore I decided to build a tipping point chart to map out my basic predictions:
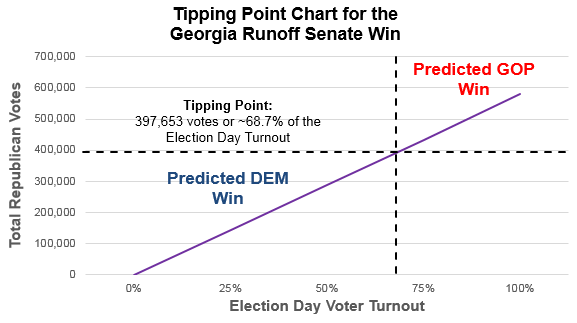
Figure 5 — If early vote proportions hold from November, what election day turnout will the Republicans need to win?
As you can see, the magic number is 68.7% of the Election Day vote. That is the tipping point that would mathematically decide the election were all voter proportions the same as November. With that, the Republicans would get around 400,000 votes and enough to take the Senate seats (I’m assuming there is little to no split-ticket voting in this runoff election). Anything less and the early vote should push the Democrats to victory in both Senate races.
By the way, to get that amount of votes the Republicans would need 668,797 people to show up to vote on Election Day. While it is an important election, accusations of election fraud by President Trump, the second COVID wave and the fact that the ballot does not include any other votes may make it hard for the Republicans to hit that total.
I am a Simulation & Strategy Consultant at Monitor Deloitte, I use stats and analytics to inform Digital Twin models that re-invent the way companies approach strategic decisions. In my free time, I’m obsessed with politics and policy, blogging about it all the time at Policy In Numbers. You can find me there or at my LinkedIn and Twitter accounts (feel free to connect or give me a follow).