Twitter

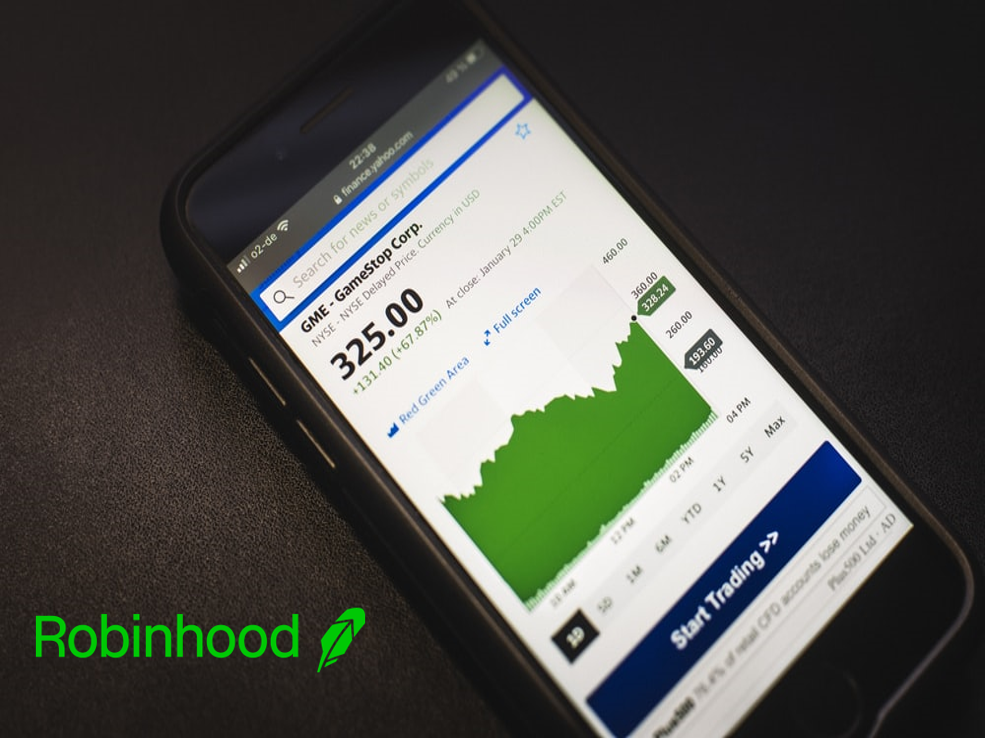
Analyzing Brand Sentiment with Robinhood, Gamestop & R

Brands are essential. They live in our minds as ideas and each person constantly interacts with hundreds of brands a day, sometimes positively, sometimes negatively. But what is their role in data science? Well given most tech is fueled by strong business brands, it is probably essential for any data scientist to have even a basic an understanding of brands. In this post, I want to explain how to do a simple brand sentiment analysis using Twitter.

Continue reading

Animating England's Lockdown Tier Maps in R

Since October, the UK’s COVID-19 strategy has been defined by the government’s Lockdown Tier system. Different regions, councils and cities have had their lockdowns change from Tier 1 - Medium Alert to the newly introduced Tier 4 - Stay At Home. Now everybody is in a national lockdown, but people all over the country continuously had trouble keeping track of what tier they were in, and what restrictions they had to abide with.

Continue reading